
Market Analysis, Using Excel
Analyzed 2,000+ rows of customer behavioral marketing data in Excel using VLOOKUPS, Pivot Tables, and charts to evaluate campaign success level.

I’ve been working as a data analyst the past number of years. I love to use my skills in SQL, Tableau, Power BI, Excel, Python, and R to transform data into impactful insights that lead to the best business decisions. I also have a passion for sharing my learnings in data analytics; hence why I created this site.

Explored Vancouver's urban greenery and presented dashboard enriched with an interactive map.

Dove into the numbers using simple SQL to uncover how the International Development Association (IDA) came to the rescue, exctending $10b USD to countries in need during and after the pandemic.
Analyzed 2,000+ rows of customer behavioral marketing data in Excel using VLOOKUPS, Pivot Tables, and charts to evaluate campaign success level.

Analyzed churn data for a telecom company, identified factors driving churn, and segmented high-risk customers.

For this project, I am taking on the role of Marketing Analyst for Luminatory Data Solutions Company, utilizing Power BI to craft an interactive report. Throughout this project, I familiarized myself with digital marketing terminology and associated costs, while also honing my skills in generating interactive reports using Power BI.

Analyzed marketing campaigns and presented actionable data solutions to improve future campaigns.

Analyzed clinical care data spanning 10 years (1999-2008) from 130 US hospitals and integrated delivery networks.
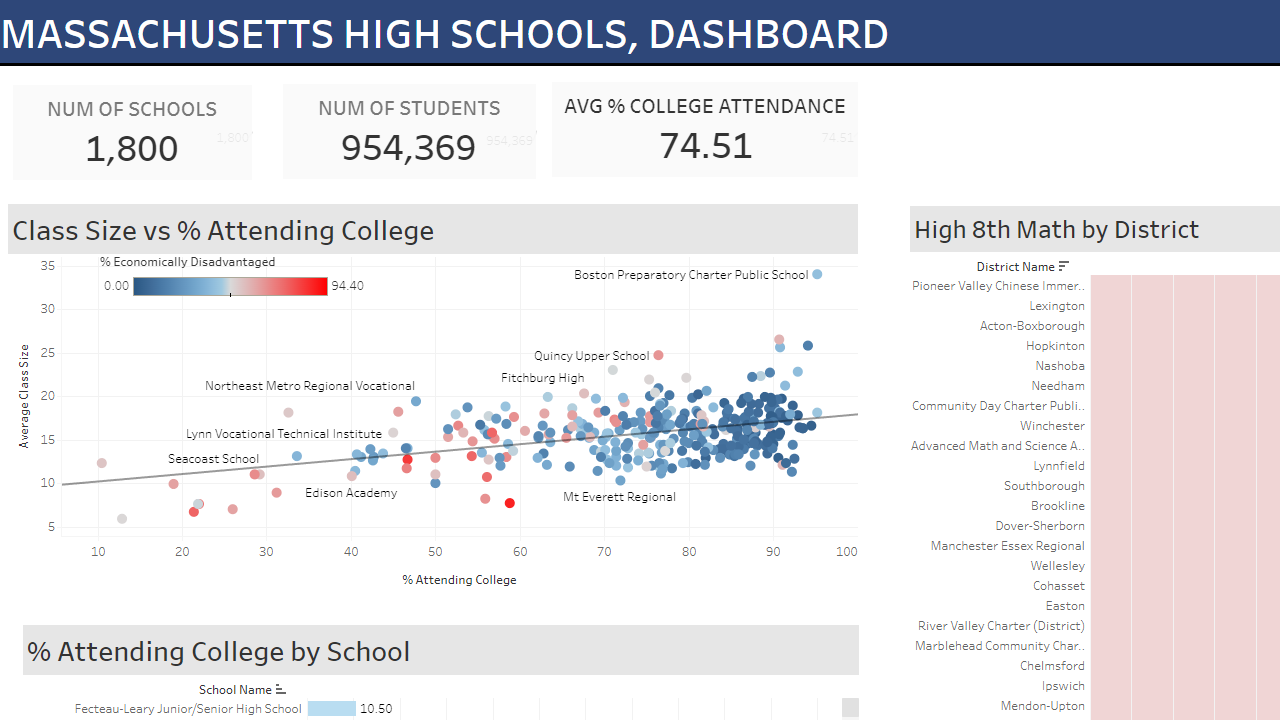
Created dashboard in Tableau investigating 1,800+ of Massachusetts school systems allowing understanding the college attendance rate and where the state needs to focus to grow college attendance, as well as schools that are falling behind and recommendations on what to do.
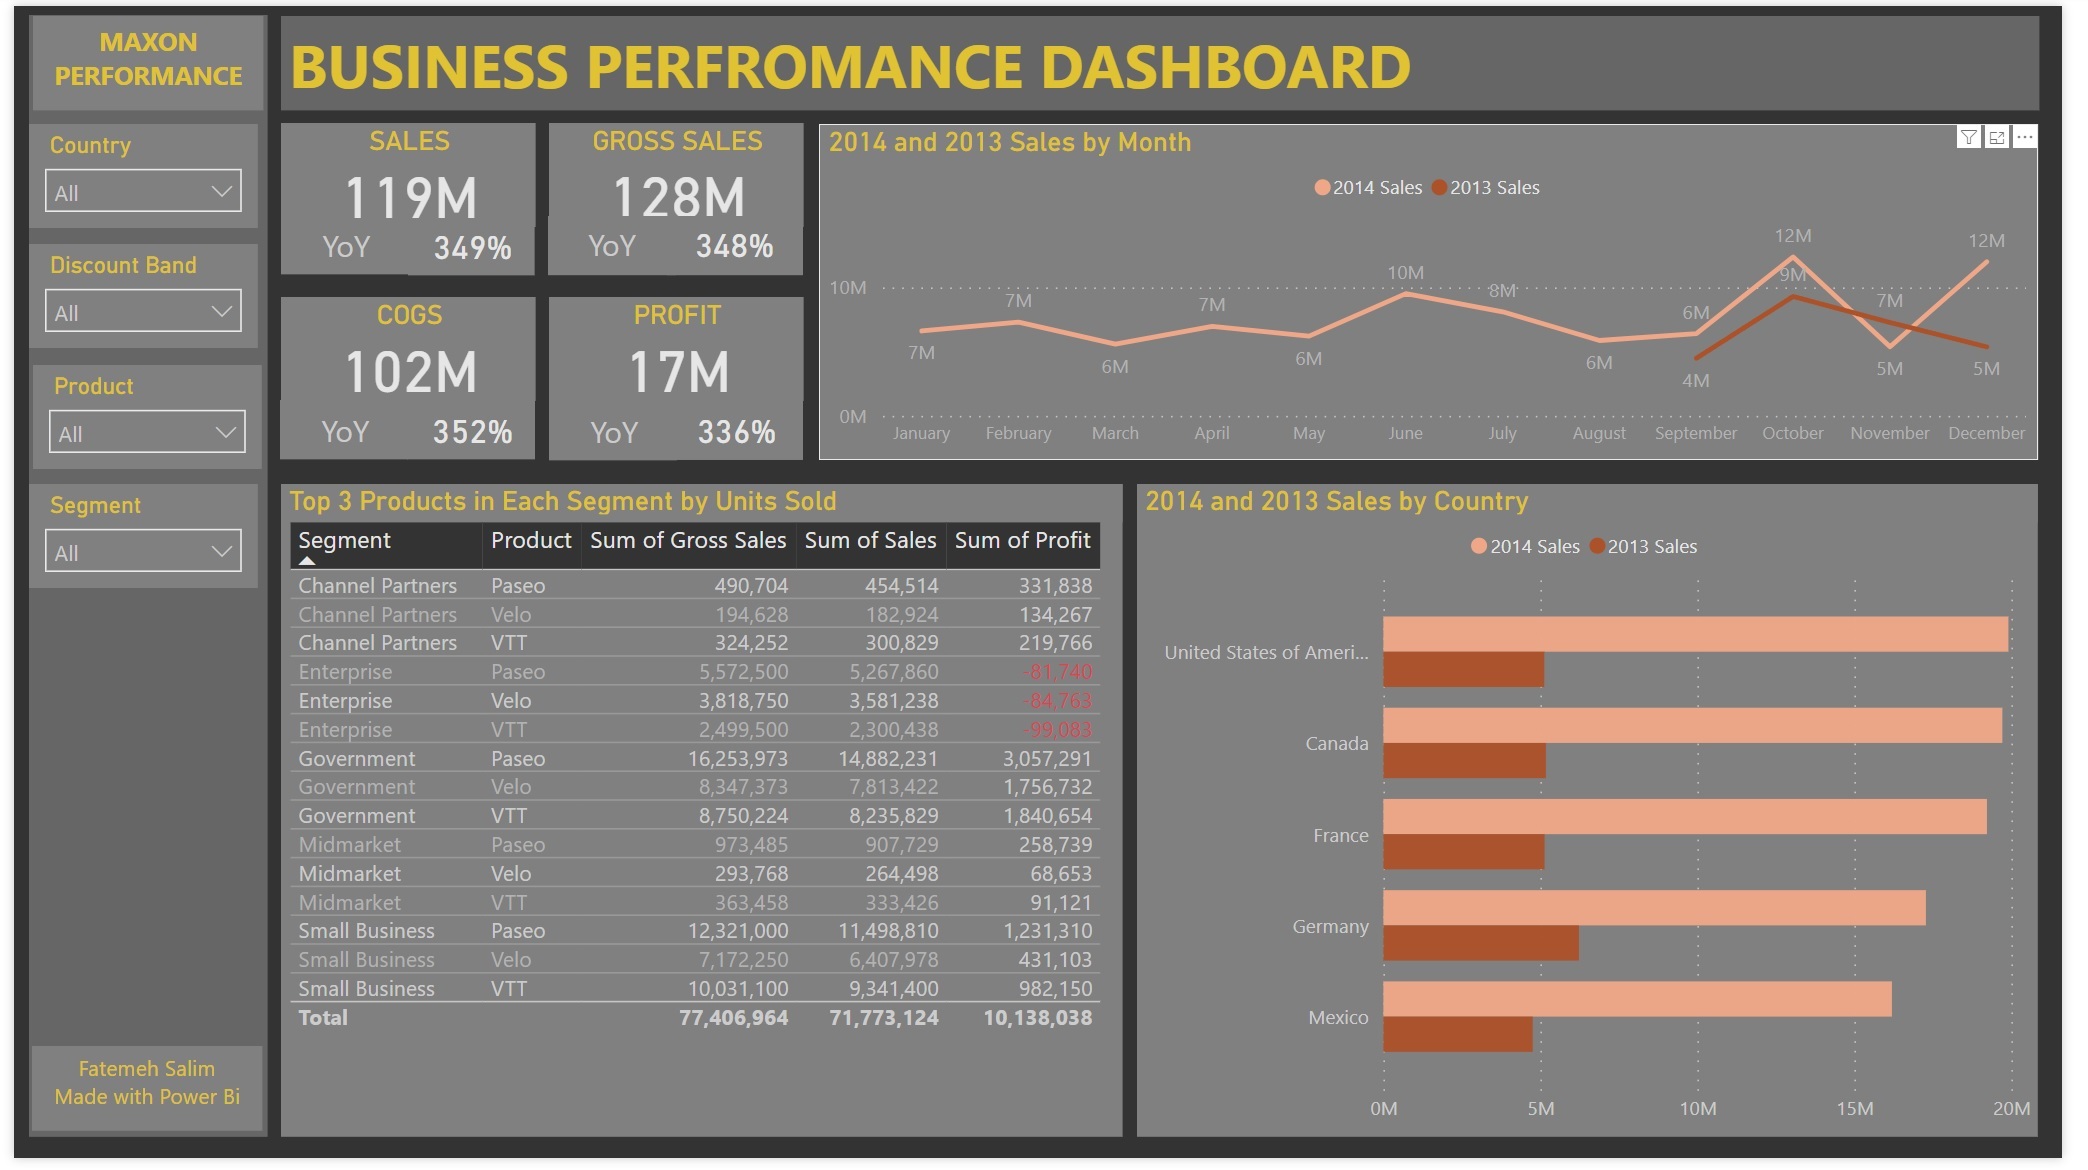
Developed a comprehensive Power BI dashboard that delves into Maxon's business performance, showcasing key performance indicators (KPIs) and providing insightful visualizations of sales and profit metrics across diverse geographical regions.

The goal of this exploratory data analysis is to gain insights into the Vancouver street trees data, identify patterns, spot anomalies, and formulate hypotheses that can lead to further investigation or modeling.

I've always been curious about which Disney character is the most popular and has made the most money.If we consider the factor of time in our analysis, we can gain an understanding of how the taste of audience changed over time.
Thank you for checking out my portfolio! Feel free to connect with me on LinkedIn or send me an email.